What is GDP and how to make money on it
Every person has at least once been puzzled by the question, “What is GDP?” This figure is one of the crucial indicators of both the global economy, and the economy of each country.
Based on the GDP growth rates, we can determine whether the economy is developing or stagnating, while the traders can even make money on it.
Contents:
GDP: What is it and how to measure it
GDP stands for gross domestic product. It is a total monetary or market value of all goods and services produced in the country in a specific time period.
There are two types of GDP: nominal gross domestic product and real gross domestic product.
1. Nominal GDP is calculated using the current prices. Not only a change in the real output of goods and services, but also price level changes have an impact on it.
2. Real GDP is an inflation-adjusted indicator expressed in base-year prices. The economists can choose the base year as they deem fit. To calculate the real gross domestic product, we have to divide the nominal GDP over a GDP deflator.
Change in GDP and what it means
Now let’s consider the importance of this indicator. Every country produces goods and services both for domestic consumption and for export. If their figures are rising, it means the economy is developing. If, for some reason, there is a decline in production of goods and services, it points to an economic slowdown.
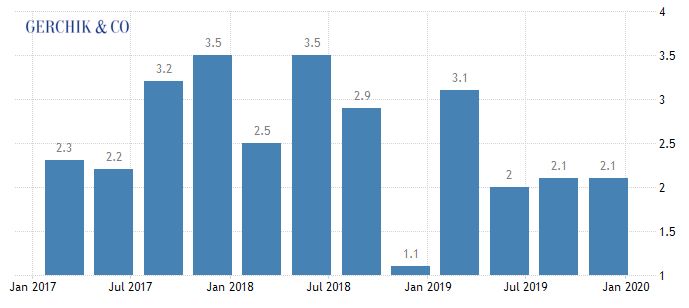
Typically, economists measure the GDP growth rate i.e. the percentage by which the indicator has increased over a specific time period (month, quarter, year). On the chart below, you can see the United States GDP growth rate.
.jpeg)
When GDP growth rates are increasing by less than 2-3% for several years, this is a sign of recession. A sharp decline in GDP means that an economic crisis is about to begin.
Based on the GDP growth dynamics, two states of the economy — stagnation and depression — can be singled out. Stagnation takes place when gross domestic product is barely growing, yet there is no dramatic decline. When there is a dramatic drop in GDP figures for several years, this is called an economic depression and implies a protracted crisis.
Causes of increase and decline in GDP
Answering the question, “What is GDP?”, we established that it is a total value of all goods and services produced in the country. In the stable economy, people have jobs and money; there is a growing demand for goods and services. Increase in demand leads to an increase in supply. Consequently, production grows, and so does the GDP.
However, production can stop or slow down for a number of reasons, one of which is a drop in demand. With increasing unemployment rate in the country, the population becomes insolvent, thus cutting back on purchases and expenses. This, in turn, leads to a drop in demand. According to the laws of the market-oriented economy, businesses and enterprises start reducing production.
Suspension of operation of small and medium-sized businesses, as well as a number of big companies is the second reason the world didn’t expect in 2020. Due to the coronavirus pandemic and lockdowns around the globe, people obviously cannot generate GDP while self-isolating at home.
GDP growth rates highly depend on the inflation rate and the state of the labor market.
With a reduction in unemployment and an increase in employment, GDP grows in the country, as a solvent population increases the demand for goods and services, automatically stimulating the growth of supply. In case of high inflation, nominal gross domestic product increases too.
We established that real GDP is calculated using the prices of the chosen base year. Therefore, real economic growth rates can be significantly lower.
How to make money on GDP
Changes in GDP growth rates affect the exchange rate of the national currency. This is the reason why traders who trade in the financial markets can make money using this indicator.
It is known that the higher the economic growth-rate growth, the stronger the currency, and vice versa. The acceleration of GDP growth is what has the biggest impact on the exchange rate. Knowing what GDP is and how it is connected to other economic indicators, you can predict the exchange rate movement direction.
Understanding what GDP is and how critically important it is when it comes to assessment of economic situation, the central bank can change its monetary policy based on its value. If economic growth slows down, the central bank may lower the interest rate or even implement a quantitative easing (QE) program. This will allow reducing the cost of loans, which, in turn, should spur development. That said, such measures will make national currency weaker.
By keeping track of the economic growth rates, the trader can understand the GDP dynamics and whether it will lead to lower rates and a drop in foreign currency. If this is the case, it would make sense to go short. On the flip side, changes in GDP growth rates may affect the currency exchange rate when statistical data are released.
By checking out the economic calendar, you can learn the schedule of release dates of GDP statistics by country. It typically demonstrates the previous value, forecast and the actual current value. If the actual value exceeds the forecasted one, the currency may increase. If it is lower, it may drop. The traders take advantage of these situations to make a speculative profit by trading news.

Understanding the essence of GDP and being able to track down its change in the economic calendar, you now know how to make money on it. However, GDP is a lagging indicator, which means that is often released two months after the end of the reporting period.
To calculate whether the economic growth rates will be higher or lower than the figures of the previous period, you can also keep an eye on the data of other indicators that real GDP depends on. This can be statistics on retail sales, durable goods orders, business activity indices in the services and production sectors.
When the figures demonstrate positive dynamics, we can expect a solid increase in GDP. This, in turn, evidences the economic strengthening and drives up the value of the currency. At the same time, traders get the chance to make profit by buying it.
Gross Domestic Product (GDP)
A monetary measure of the market value of all final goods and services produced in a period (quarterly or yearly).
Determining gross domestic product (GDP)
GDP can be determined in three ways, all of which should, theoretically, give the same result. They are the production (or output or value added) approach, the income approach, and the speculated expenditure approach. It is representative of the total output and income within an economy.
The most direct of the three is the production approach, which sums the outputs of every class of enterprise to arrive at the total. The expenditure approach works on the principle that all of the product must be bought by somebody, therefore the value of the total product must be equal to people's total expenditures in buying things. The income approach works on the principle that the incomes of the productive factors ("producers", colloquially) must be equal to the value of their product, and determines GDP by finding the sum of all producers' incomes.
Production approach
Also known as the Value Added Approach, it calculates how much value is contributed at each stage of production.
This approach mirrors the OECD (Organisation for Economic Co-operation and Development) definition given above.
- Estimate the gross value of domestic output out of the many various economic activities;
- Determine the intermediate consumption, i.e., the cost of material, supplies and services used to produce final goods or services.
- Deduct intermediate consumption from gross value to obtain the gross value added.
Gross value added = gross value of output – value of intermediate consumption.
Value of output = value of the total sales of goods and services plus value of changes in the inventory.
The sum of the gross value added in the various economic activities is known as "GDP at factor cost".
GDP at factor cost plus indirect taxes less subsidies on products = "GDP at producer price".
For measuring output of domestic product, economic activities (i.e. industries) are classified into various sectors. After classifying economic activities, the output of each sector is calculated by any of the following two methods:
- By multiplying the output of each sector by their respective market price and adding them together
- By collecting data on gross sales and inventories from the records of companies and adding them together
The value of output of all sectors is then added to get the gross value of output at factor cost. Subtracting each sector's intermediate consumption from gross output value gives the GVA (=GDP) at factor cost. Adding indirect tax minus subsidies to GVA (GDP) at factor cost gives the "GVA (GDP) at producer prices".
Income approach
The second way of estimating GDP is to use "the sum of primary incomes distributed by resident producer units".
If GDP is calculated this way it is sometimes called gross domestic income (GDI), or GDP (I). GDI should provide the same amount as the expenditure method described later. By definition, GDI is equal to GDP. In practice, however, measurement errors will make the two figures slightly off when reported by national statistical agencies.
This method measures GDP by adding incomes that firms pay households for factors of production they hire — wages for labour, interest for capital, rent for land and profits for entrepreneurship.
The US "National Income and Expenditure Accounts" divide incomes into five categories:
- Wages, salaries, and supplementary labour income
- Corporate profits
- Interest and miscellaneous investment income
- Farmers' incomes
- Income from non-farm unincorporated businesses
These five income components sum to net domestic income at factor cost.
Two adjustments must be made to get GDP:
- Indirect taxes minus subsidies are added to get from factor cost to market prices.
- Depreciation (or capital consumption allowance) is added to get from net domestic product to gross domestic product.
Total income can be subdivided according to various schemes, leading to various formulae for GDP measured by the income approach. A common one is:
GDP = COE + GOS + GMI + taxes less subsidies on production and imports TP & M – SP & M
- Compensation of employees (COE) measures the total remuneration to employees for work done. It includes wages and salaries, as well as employer contributions to social security and other such programs.
- Gross operating surplus (GOS) is the surplus due to owners of incorporated businesses. Often called profits, although only a subset of total costs are subtracted from gross output to calculate GOS.
- Gross mixed income (GMI) is the same measure as GOS, but for unincorporated businesses. This often includes most small businesses.
The sum of COE, GOS and GMI is called total factor income; it is the income of all of the factors of production in society. It measures the value of GDP at factor (basic) prices. The difference between basic prices and final prices (those used in the expenditure calculation) is the total taxes and subsidies that the government has levied or paid on that production. So adding taxes less subsidies on production and imports converts GDP(I) at factor cost to GDP(I) at final prices.
Total factor income is also sometimes expressed as:
Total factor income = employee compensation + corporate profits + proprietor's income + rental income + net interest
Expenditure approach
The third way to estimate GDP is to calculate the sum of the final uses of goods and services (all uses except intermediate consumption) measured in purchasers' prices.
Market goods that are produced are purchased by someone. In the case where a good is produced and unsold, the standard accounting convention is that the producer has bought the good from themselves. Therefore, measuring the total expenditure used to buy things is a way of measuring production. This is known as the expenditure method of calculating GDP.
Components of GDP by expenditure
GDP (Y) is the sum of consumption (C), investment (I), government Expenditures (G) and net exports (X – M).
Y = C + I + G + (X − M)
Here is a description of each GDP component:
- C (consumption) is normally the largest GDP component in the economy, consisting of private expenditures in the economy (household final consumption expenditure). These personal expenditures fall under one of the following categories: durable goods, nondurable goods, and services. Examples include food, rent, jewelry, gasoline, and medical expenses, but not the purchase of new housing.
- I (investment) includes, for instance, business investment in equipment, but does not include exchanges of existing assets. Examples include construction of a new mine, purchase of software, or purchase of machinery and equipment for a factory. Spending by households (not government) on new houses is also included in investment. In contrast to its colloquial meaning, "investment" in GDP does not mean purchases of financial products. Buying financial products is classed as 'saving', as opposed to investment. This avoids double-counting: if one buys shares in a company, and the company uses the money received to buy plant, equipment, etc., the amount will be counted toward GDP when the company spends the money on those things; to also count it when one gives it to the company would be to count two times an amount that only corresponds to one group of products. Buying bonds or companies' equity shares is a swapping of deeds, a transfer of claims on future production, not directly an expenditure on products; buying an existing building will involve a positive investment by the buyer and a negative investment by the seller, netting to zero overall investment.
- G (government spending) is the sum of government expenditures on final goods and services. It includes salaries of public servants, purchases of weapons for the military and any investment expenditure by a government. It does not include any transfer payments, such as social security or unemployment benefits. Analyses outside the USA will often treat government investment as part of investment rather than government spending.
- X (exports) represents gross exports. GDP captures the amount a country produces, including goods and services produced for other nations' consumption, therefore exports are added.
- M (imports) represents gross imports. Imports are subtracted since imported goods will be included in the terms G, I, or C, and must be deducted to avoid counting foreign supply as domestic.
Note that C, I, and G are expenditures on final goods and services; expenditures on intermediate goods and services do not count. (Intermediate goods and services are those used by businesses to produce other goods and services within the accounting year.) So for example if a car manufacturer buys auto parts, assembles the car and sells it, only the final car sold is counted towards the GDP. Meanwhile, if a person buys replacement auto parts to install them on their car, those are counted towards the GDP.
According to the U.S. Bureau of Economic Analysis, which is responsible for calculating the national accounts in the United States, "In general, the source data for the expenditures components are considered more reliable than those for the income components"
Types of GDP?
GPD can be measured in several different ways. The most common methods include:
INTRODUCTION

You must have heard about GDP somewhere. In newspapers or sometimes on the news channel or sometimes elsewhere. Does the question arise in our minds as what is GDP ?.
When GDP declines for two consecutive quarters or more, by definition the economy is in a recession. Meanwhile, when GDP grows too quickly and fears of inflation arise.
Due to lockdown India’s GDP tremendously goes down.
Let’s see what is the GDP, if you fully read this blog, you will definitely get to know about GDP.
Before going to understand GDP let understand Import & Export.
What is Import & Export ?
Every country wants it to progress. Whether it is a small country, big country, rich or poor, but whose development is being talked about here?
Here it is talked about the development of the people living in the country, but now the question is how will people develop.
When people get clothes to wear, food to eat, work to earn, home to live. Then the country will progress.
The simple thing is that the more facility we get, the more development will be ours, for that country need to increase the production of Goods.
When the production of anything in a country starts to exceeding, then that country starts selling it in another country.
As there is a lot of oil in Arab countries, they sell oil in other countries. But when there is less production in a country, then it is forced to buy goods from another country.
When any goods have to be bought from another country, it is called Import.
When an item is sold to another country, it is called Export.
Who Invented GDP?
After the First World War, there was an economic depression. It took 10 years to emerge from that economic recession.
At that time, someone thought that if there was a scale that would be very good if we knew about the economic situation of our country.
Simon Kuznets was an American economist at the time. He coined the term GDP.
In 1945, the (International Monetary Fund) brought the GDP to the world.
What is GDP?
GDP is the most important measure of measuring the economic situation of any country.
All the services and goods produced within the border of any country within 1 year are called GDP.
If we are buying something from another country and selling it in our country. So it does not count in GDP because the money will be given to the other country.
Note: Only goods made in our country are counted in GDP.
For example, if 10 fans are made in a country and the cost of 1 fan is ₹ 500, then the cost of 10 fans will be ₹ 5000. So it will be the GDP of that country.
In India, GDP is calculated every 3 months.
Area for Measuring GDP
Now the question will come in your mind that if there are small and small things in our country like an eraser, pencil, needle, etc.
Then which thing will be counted, so there are three departments for calculating GDP in India.
First, Agriculture, Second Industry, and Third Service. Looking at these 3 areas, it is said that India’s GDP is good or bad.
Different Types of GDP
There are 2 types of GDP. First Nominal GDP and second Real GDP. Nominal GDP means that when the price of a commodity keeps increasing, we call it nominal GDP.
Let’s understand this with an example, if only 5 fans are made in place of 10 fans in our country and its price is increased from ₹ 500 to ₹ 1000, then the GDP of that country will be ₹ 5000 now, but the point of view is that Now the GDP of that country has increased due to inflation, that is, on the day when the price of the fan decreases, the GDP of that country will also fall, so inflation is not counted in the GDP.
Therefore, CSO (Central Statistics Office) fixes a price for all goods in a base year. It is decided on the basis of this that GDP has decreased or is larger.
The formula for extracting GDP is very simple.
GDP = C + G + I + (Exports — Imports)
C = Your Personal Consumption,
G = Government Investment,
I = Business Investment,
- Nonresidential (spending on plants and equipment).
- Residential (single-family and multi-family homes).
Now let us consider this formula with an example.
Suppose your own Expense is ₹ 100, which we are saying Some money is invested by the government, from that we assume ₹ 10000, which we are calling Investment of the private company also has a big hand in the GDP of the country, we assume ₹ 5000 C. G. I.
We imported goods worth ₹ 4000 from China. Exported goods worth ₹ 1000 to Nepal.
= 100 + 10000 +5000 + (1000–4000)
= 100 + 10000 +5000 — 3000
= 12100
In this way, the GDP of any country is extracted. Therefore, it is said that the more production in which country grows, the greater will be the growth of that country.
Today why India’s GDP is continuously going down because people are using others country goods more than own country. That’s why our country’s money is going to their country.
Therefore, it becomes our responsibility to use our national goods to gain GDP.
Клиентам
Для определения внутреннего валового продукта (ВВП) в любой стране исследуются цены товаров, которые она производит, а также стоимость предоставляемых ею услуг. Данный показатель выражается в процентном отношении и фиксирует ценовые изменения с учетом инфляционных процессов по отношению к прошедшим периодам.
Результат ВВП является основным фактором, на который чутко и реально реагируют денежные единицы стран, представленных на международной валютной бирже. Основополагающими на данной платформе являются результаты Gross Domestic Product в таких странах, как США, Великобритания, Канада, Австралия, Новая Зеландия. Абсолютно прогнозируемо и объяснимо в этот список недавно уверенно вошел Китай. Его экономика поставляет около 40% продукции от общего мирового производства.
Информационные данные по ВВП могут отражаться в трех формах:
- предварительной,
- скорректированной,
- окончательной.
Каждая из них может оказывать различное влияние на торговлю участвующих в этом процессе стран. Но наиболее эффективной является предварительная форма отчета. Именно прогнозируемые данные приводят в движение механизм торгов, которые чутко реагируют на любую новую тенденцию в экономиках сильных государств.
Время выхода сообщений о ВВП
Для каждой страны время опубликования этих данных установлено отдельно. Для удобства ожидания информации необходимо знать, что оно указывается по североамериканскому восточному часовому поясу (EST). Поэтому для США временной показатель выхода информации о ВВП выглядит наиболее естественно – 8-30 утра.
Предварительное оценивание общего состояния экономики в Штатах проводится поквартально и предоставляется огласке на сайте Бюро эконом анализа через тридцать дней после окончания этого периода. Интерес к публикации этой информации проявляют также крупнейшие информационные ресурсы, такие как Блумберг, Ройтерс и другие. Аналитика подается в формате годовой значимости.
Отчеты от Бюро статистики Австралии о состоянии GDP следует ожидать через 65 дней после окончания квартала в 21-30. Отчет ВВП Китая также освещает квартальный период. Он выходит спустя всего 18 дней после его окончания в 22-00. Ресурсом, который показывает его первым, является сайт государственного Нацбюро статистики.
Функции по определению и опубликованию данных о внутреннем валовом продукте в Великобритании возложены на статистическое Национальное агентство. Предварительные данные учреждение предоставляет на 24 день после окончания подотчетного квартала в 5-30. А с уточненной оценкой, которая оказывает большее влияние на процесс торгов, трейдеры могут ознакомиться через месяц в то же время.
Канадское статагентство предоставляет результаты своего анализа через 60 суток по результатам подотчетного месяца в 8-30. Особенность аналитики заключается в том, что это единственная страна, чья денежная единица является основной, а отчеты собираются за месячный период. Это является причиной того, что каждый выпуск такого документа оказывает ощутимое влияние на ход торгов. Выпуск ежеквартального отчета ВВП Канады основывается на составлении уже публиковавшихся месячных релизах, поэтому на рынке такое событие проходит почти незамеченным.
Новозеландский отчет представляет государственное статагентство этой страны не раньше чем через 80 дней после окончания подотчетного квартала. Условия публикации такие же, как и у остальных участников данного процесса.
Интерпретация отчетных данных по ВВП
Выход информации по валовому внутреннему продукту влиятельных на биржевом рынке стран воспринимается как значимое новостное событие. В экономических календарных списках индикаторы, связанные с показателями GDP, находятся на первоочередных по важности позициях. Обычно уже через 30 минут после опубликования отчетов колебания на торгах могут составлять около 150 единиц.
Информация о ВВП отражает среднестатистический показатель экономического потенциала и активности страны, а также сообщает о состоянии дееспособности ее экономики. В это понятие входят такие факторы, как загруженность производства, социальные проблемы, торговля, уровень потребительских расходов и прочее. Поэтому позитивные отчеты о состоянии экономики страны благотворно сказываются на стоимости ее валюты.
Для определения внутреннего валового продукта (ВВП) в любой стране исследуются цены товаров, которые она производит, а также стоимость предоставляемых ею услуг. Данный показатель выражается в процентном отношении и фиксирует ценовые изменения с учетом инфляционных процессов по отношению к прошедшим периодам.
Результат ВВП является основным фактором, на который чутко и реально реагируют денежные единицы стран, представленных на международной валютной бирже. Основополагающими на данной платформе являются результаты Gross Domestic Product в таких странах, как США, Великобритания, Канада, Австралия, Новая Зеландия. Абсолютно прогнозируемо и объяснимо в этот список недавно уверенно вошел Китай. Его экономика поставляет около 40% продукции от общего мирового производства.
Информационные данные по ВВП могут отражаться в трех формах:
- предварительной,
- скорректированной,
- окончательной.
Каждая из них может оказывать различное влияние на торговлю участвующих в этом процессе стран. Но наиболее эффективной является предварительная форма отчета. Именно прогнозируемые данные приводят в движение механизм торгов, которые чутко реагируют на любую новую тенденцию в экономиках сильных государств.
Время выхода сообщений о ВВП
Для каждой страны время опубликования этих данных установлено отдельно. Для удобства ожидания информации необходимо знать, что оно указывается по североамериканскому восточному часовому поясу (EST). Поэтому для США временной показатель выхода информации о ВВП выглядит наиболее естественно – 8-30 утра.
Предварительное оценивание общего состояния экономики в Штатах проводится поквартально и предоставляется огласке на сайте Бюро эконом анализа через тридцать дней после окончания этого периода. Интерес к публикации этой информации проявляют также крупнейшие информационные ресурсы, такие как Блумберг, Ройтерс и другие. Аналитика подается в формате годовой значимости.
Отчеты от Бюро статистики Австралии о состоянии GDP следует ожидать через 65 дней после окончания квартала в 21-30. Отчет ВВП Китая также освещает квартальный период. Он выходит спустя всего 18 дней после его окончания в 22-00. Ресурсом, который показывает его первым, является сайт государственного Нацбюро статистики.
Функции по определению и опубликованию данных о внутреннем валовом продукте в Великобритании возложены на статистическое Национальное агентство. Предварительные данные учреждение предоставляет на 24 день после окончания подотчетного квартала в 5-30. А с уточненной оценкой, которая оказывает большее влияние на процесс торгов, трейдеры могут ознакомиться через месяц в то же время.
Канадское статагентство предоставляет результаты своего анализа через 60 суток по результатам подотчетного месяца в 8-30. Особенность аналитики заключается в том, что это единственная страна, чья денежная единица является основной, а отчеты собираются за месячный период. Это является причиной того, что каждый выпуск такого документа оказывает ощутимое влияние на ход торгов. Выпуск ежеквартального отчета ВВП Канады основывается на составлении уже публиковавшихся месячных релизах, поэтому на рынке такое событие проходит почти незамеченным.
Новозеландский отчет представляет государственное статагентство этой страны не раньше чем через 80 дней после окончания подотчетного квартала. Условия публикации такие же, как и у остальных участников данного процесса.
Интерпретация отчетных данных по ВВП
Выход информации по валовому внутреннему продукту влиятельных на биржевом рынке стран воспринимается как значимое новостное событие. В экономических календарных списках индикаторы, связанные с показателями GDP, находятся на первоочередных по важности позициях. Обычно уже через 30 минут после опубликования отчетов колебания на торгах могут составлять около 150 единиц.
Информация о ВВП отражает среднестатистический показатель экономического потенциала и активности страны, а также сообщает о состоянии дееспособности ее экономики. В это понятие входят такие факторы, как загруженность производства, социальные проблемы, торговля, уровень потребительских расходов и прочее. Поэтому позитивные отчеты о состоянии экономики страны благотворно сказываются на стоимости ее валюты.