Fundamental analysis: how to trade PMI (as Illustrated by examples)
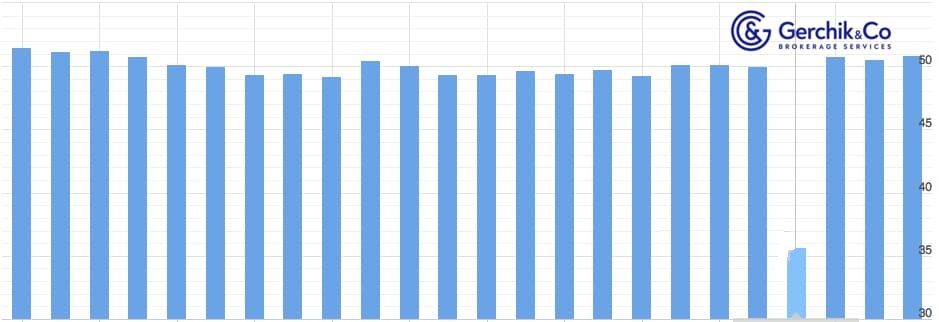
While the coronavirus pandemic is hitting the global economy, and GDP is reflecting the extent of damages with a delay, leading indicators come out on top. In this article, we are going to take a closer look at one of these indicators — Purchasing Managers’ Index (PMI). Let’s find out what it is, how to interpret its values correctly, and how it impacts the exchange rate.
Contents:
What Is the PMI
The PMI belongs to leading economic indices (indicators) that are also known as surveys. It is leading because its value shows how the situation will (or may) unfold in the future.
This indicator is based on a survey of purchasing managers at large companies. In this case, the questions relate to the number of orders, employment details, production output, export and import prices, and warehouse stocks. In addition, managers are asked to rate whether the situation in their business area improved, worsened, or remained the same. The responses help shape the final indicators.
We measure the PMI values from zero to 100. However, there is a ‘watershed,’ i.e., 50 points. If the index is above this value, the economy will keep growing. If it is below 50, this is an economic slowdown. Perhaps this is the main thing that you need to know in order to assess your PMI and draw a conclusion about the current economic climate.
In addition, we measure the PMI in two sectors of the economy. The first sector shows what is happening in the production industry, while the second sector gives an idea of what is going on in sectors of the economy and areas that offer services to ensure that the population enjoys decent living conditions.
The exchange rate is more influenced by the PMI that corresponds to the prevailing sector of the economy. In the case of China and Germany, the manufacturing PMI is more important, since the share of the manufacturing sector prevails in GDP. In terms of the USA, where GDP mainly depends on the consumption sector, the services PMI has a greater impact on the exchange rate.
- liMI is tyliically released on the first business day of the month following the reliorting lieriod.
- The figures are used to make forecasts regarding GDli, emliloyment rate, industrial outliut growth, and orders for the goods.
- When the liMI is about 44%, there’s is a high likelihood that GDli growth rate will be close to zero.
- On average, liMI liredicts the economic downturn in 2-3 months ahead.
PMI Dynamics and How It Impacts the Exchange Rate
As you know, the market is driven by expectations. Therefore, when most important macroeconomic indicators become available, we see a local surge in volatility if the actual value does not match the forecast.
When we consider the PMI (what it is) and its threshold separating growth dynamics from declines, it is important what side of 50 its indicators are on.
E.g. Before the trade war between the US and China and prior to the coronavirus crisis, the major developed countries had PMI values well above 50. In this case, minor deviations from forecasted values virtually did not impact any exchange rates.
However, when the PMI reaches 50 and crosses this ‘watershed’, the market perceives the situation more sensitively, as it becomes clear that the economy moves from the growth stage to the decline one.
It should be noted that an economic slowdown in China and Germany due to the trade war was first proved by the manufacturing PMIs. These were the first wake-up calls, even before GDP indicators showed a slowdown. When the quarantine measures were mitigated, the revival of businesses was proved by the PMI as well.
Let’s take a look at the most interesting PMIs: China, Germany, and the USA.
Trade popular currencies on best terms!
Open an account at Gerchik & Co!
PMIs in Economies of Various Countries: Data Analysis
China is known to be the world’s largest manufacturing-based economy. An industrial slowdown in China suggests that GDP growth will be hit hard.
When the USA set off the trade war against China in the second half of 2018, it backfired on the manufacturing sector. The imposed duties meant that it became less profitable for China to manufacture goods for export to the USA. The manufacturing PMI (China) demonstrated a decline: it reached 50 in November 2018 and 49.40 in December.
Monthly values: 49.50 in January 2019 and 49.20 in February. In 2019, the China manufacturing PMI was mostly below 50, as trade relations between the USA and China were strained.
At the end of 2019, China faced a new challenge — the COVID-19 outbreak. Tough quarantine rules were introduced in early 2020, the economy stalled out, and the manufacturing PMI dropped to 37.50 in February. However, China was the first to overcome a COVID-19 wave, and the manufacturing PMI reached 50.90 in June, which, as you already know, means that this sector of the economy is moving to the growth stage.

Germany manufacturing PMI. The economy of Germany has a large manufacturing sector as well. Moreover, the economy of Germany with its manufacturing sector is the powerhouse of the entire eurozone economy.
The China-United States trade war has disrupted supply chains and has affected the manufacturing sector of Germany. Back in November 2018, the Germany manufacturing PMI was at 51.80 and 44.30 in May 2019! (44.30 are well below 50, and this means that the manufacturing sector has been seriously affected).
Meanwhile, the European Central Bank has been discussing the monetary policy measures, such as the possibility of launching a quantitative mitigation program that could protect the economy from the crisis.
The coronavirus pandemic has resulted in a slowdown in the manufacturing sector of Germany. The PMI dropped to 34.40 in April.

Italy services PMI. Despite the fact that the economy of Italy is not as influential in the eurozone as the economy of Germany, the services PMI of this country clearly shows how the index changes during the crisis. Italy is known to be the hardest hit by the coronavirus pandemic. And since the service sector prevails over the manufacturing one, the non-manufacturing PMI will be the most significant indicator.
The Italy services PMI was 51–52 before the pandemic and dropped to 17.40 in February (17.40, Carl! This is the most severe crisis!).

US PMIs. In conclusion, we should be paying special attention to the US PMIs. In the USA, the Institute for Supply Management collects data and calculates these leading indexes. Therefore, the US PMIs are often referred to as the ISM or the ISM PMI. The formula, watershed (50 points), and interpretation principles are similar to other PMIs.
We need to keep in mind that the US economy is a consumer economy, which means that the US ISM non-manufacturing PMI is more important and has a greater impact on the US dollar rate.
To recap, the market pays more attention to the ISM when the index exceeds 50.
During the quarantine caused by the coronavirus pandemic, these indicators dropped well below 50. The US ISM manufacturing PMI dropped to 27.0 in April, and the US ISM non-manufacturing PMI reached 36.90.

.jpeg)
How to Trade PMIs
As we already know, the PMI dynamics can impact the exchange rate. However, these indicators are not always taken into account by the market. Sometimes they are skipped if investors are focusing on more important factors or events, e.g., trade wars, more people infected with COVID-19, labor market statistics.
Here are a few key points to consider when trading PMIs:
- When assessing PMIs, you should pay attention to what side of 50 their values are on. If it is below 50 and turns out to be even worse than the forecast, the currency may decline. Conversely, if it is above 50, this is a positive factor for the exchange rate.
- The PMI of the prevailing sector has a greater impact on the exchange rate. In Germany, the manufacturing PMI is more important, while the services PMI comes out on top in the USA.
- Volatility is impacted most heavily when the PMI crosses 50.
- At the time of publication, PMIs can lead to a local surge in currency volatility if the real values do not match the forecast. Keep that in mind when you trade the news or have open trades.
PMI is a vital economic indicator that shouldn’t be overlooked. Macroeconomic calendar and reviews that we publish on a weekly basis can help you track it down. Use this data to trade profitably.
ISM Manufacturing PMI — прогнозы экономики США и ее влияние на рынок Форекс
Исходя из последних данных экономического календаря, можно увидеть, что индикатор резко изменился, чего никак не ожидали эксперты. Их скептические прогнозы обосновываются тем, что показатели безработицы, уровня доверия потребителей и другие стремительно снижаются. Но вопреки всем законам экономики, ISM Manufacturing PMI показывает, что люди имеют накопленный капитал и готовы с ним расстаться. Причем он достиг максимального уровня за последние семь лет. Данное событие свидетельствует о том, что относительно экономики США еще можно строить оптимистические прогнозы, несмотря на то, что заказы на товары длительного пользования значительно сократились – на 1,3%. В то время как эксперты ожидали увидеть показатели не более 0,2%. Это свидетельствует о том, что доллар может закрепиться на определенной отметки. Стабилизация курса непременно сыграет на руку трейдеру, главное этим моментом умело своевременно воспользоваться.
Эксперты преподаватели
Академия FIBO Group это:
- Профессиональные эксперты — преподаватели
- 20 лет успешного преподавания FOREX
- Безупречная репутация, которой доверяют тысячи клиентов
- Награды, которыми мы гордимся
- Программы обучения для трейдеров всех уровней
- Более 15 000 трейдеров уже с нами, присоединяйтесь!
Управляемый счет (ПАММ) это услуга, для тех, кто не имеет опыта самостоятельной торговли на Forex и CFD. Управляемые счета ПАММ объединяют управляющих и инвесторов и позволяют им зарабатывать на рынке форекс. Профессиональные трейдеры получают еще одну возможность увеличить свой доход, а инвесторы выгодно вложить денежные средства. Все операции по вводу и выводу средств, включая вознаграждение управляющему, контролируются и гарантируются компанией. Выплаты распределенной прибыли производятся по окончании каждого инвестиционного периода.
Для торговли на рынке Forex мы предоставляем трейдерам счета с низкими фиксированными или плавающими спредами MT4 Fixed, счета по технологии NDD: MT4 NDD, cTrader NDD и возможность зарабатывать на изменении курсов 32 пар валют. Вы имеете возможность скачать и установить на компьютеры PC (Windows), Apple (MAC), смартфоны и планшеты на Android и iOS (iPhone и iPad) специальные торговые платформы для торговли форекс. Для всех клиентов консультации, быстрый ввод и вывод средств.
ISM Manufacturing PMI — отображение курса доллара
Для закрепления курса доллара банки США ведут активную экономическую деятельность. Они контролируют все показатели, а в частности. По всем данным экономического календаря индекс стремительно падает. Доверие к национальной валюте пока тоже нестабильное, поэтому ее курс колеблется в пределах 1,272-1,274. В процессе торгов доллар старается укрепиться на одной из этих отметок, но пока безрезультатно. В то же время даже таких результатов удалось достичь благодаря тому, что ISM Manufacturing PMI достиг максимального уровня. Это однозначно спасает положение.в данном случае играет своего рода психологическим фактором, который оказывает влияние на мнение участников финансового рынка Форекс. За счет их положительного настроя наблюдается сдерживание падения курса. Кроме этого, ISM Manufacturing PMI имеет большое значение и для инвесторов. Видя благоприятную картину и возможности для развития бизнеса, они будут делать инвестиции в развитие страны, тем самым способствовать укреплению валюты.
События, влияющие на Форекс
Экономические, социальные и политические события оказывают прямое влияние на международный валютный рынок Форекс. Трейдеры, как начинающие, так и опытные, обязаны учитывать их при работе. Ведь анализ событий, происходящих в мире, умение выделять и отмечать важные изменения – залог проведения прибыльных торговых операций. На этой странице нашего сайта собраны основные эпизоды, факты, инциденты, которые в обязательном порядке необходимо учитывать при построении стратегии.
Основные инструменты для работы на Forex.
Каждому трейдеру нужен экономический календарь. Этот инструмент позволяет изучить и использовать в работе наиболее важные новости экономики, данные отчетов, которые публикуют корпорации, отчетность стран, регионов, министерств и т.д. Благодаря анализу событий участник валютного рынка сможет:
ISM Manufacturing Index
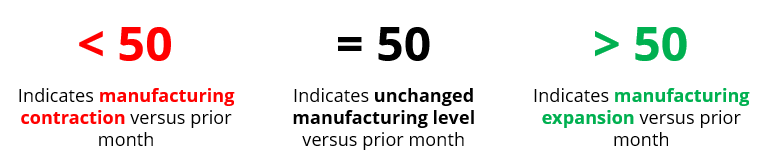
The ISM Manufacturing Index, commonly known as the ISM Manufacturing Purchasing Managers Index (ISM PMI), is a monthly gauge of the level of economic activity in the manufacturing sector in the United States versus the previous month.
The ISM Manufacturing Index is published at the beginning of each month at 10 a.m. Eastern Time by the Institute for Supply Management (ISM), a not-for-profit organization professional supply management organization based in Arizona, USA.
Founded in 1915, the ISM was formerly known as the National Association of Purchasing Management, Inc. (NAPM) until 2002, when the organization was renamed the ISM.
Key Highlights
- The ISM Manufacturing Index is a leading economic indicator for the level of economic activity in the manufacturing sector in the United States.
- A reading above 50 indicates an expansion of U.S. manufacturing, while a reading below 50 indicates a contraction.
- When the ISM Manufacturing Index is greater than expected, it bodes well for the stock market because it indicates healthy economic growth, which translates to higher corporate profits.
Understanding the ISM Manufacturing Index
The ISM Manufacturing Index is published monthly and is an important leading indicator of the U.S. economy. The reason that this economic indicator is forward-looking is how far ahead purchasing decisions need to be made for future manufacturing needs. As such, it is widely followed by economists, analysts, government, business leaders, and supply management professionals.
The index is based on a survey of purchasing and supply executives (i.e., individuals who are responsible for their firm’s supply chains) in over 400 manufacturing companies, representing 20 different industries across all 50 states out of the more than 50,000 members of the ISM. Survey participants are asked whether conditions have improved or deteriorated in 10 specific areas, or subindexes:
- New Orders
- Production
- Employment
- Inventories
- Supplier Deliveries
- Customers’ Inventories
- Prices
- Backlog of Orders
- New Export Orders
- Imports
The raw results are then compiled from the first five of the sub-indexes with equal weightings to form the ISM Manufacturing Index.
How Does the ISM Manufacturing Index Impact the Markets?
Through monitoring the ISM Manufacturing Index and comparing it to consensus estimates, investors gain a better understanding of economic trends and conditions. As a result, any deviation from consensus is viewed as a surprise, providing investors with a trading opportunity.
A higher-than-expected reading is bullish for the stock market but bearish for the bond market, and the opposite is true. When the index is greater than expected, it bodes well for the stock market because it indicates healthy economic growth, which translates to higher corporate profits.
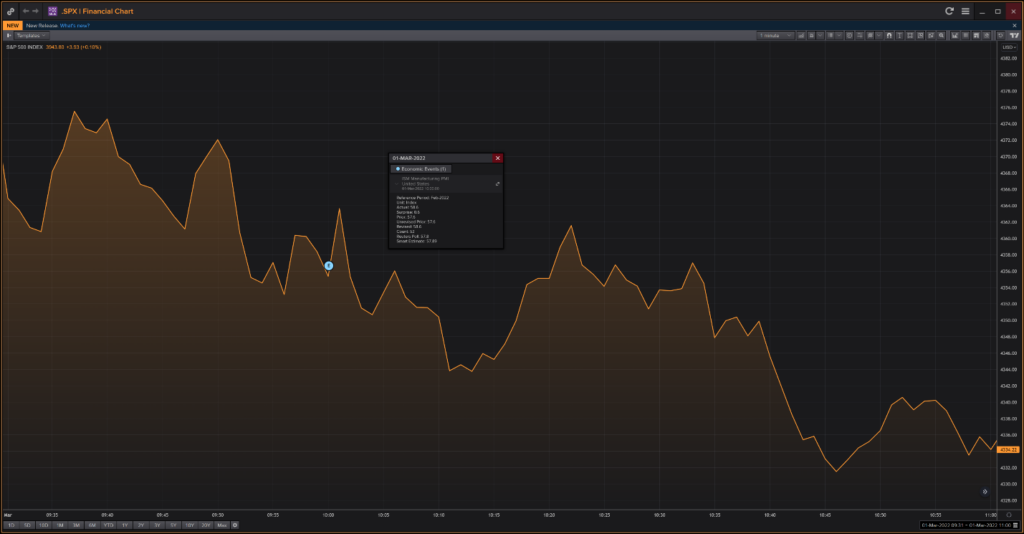
On the contrary, the index expanding greater than expected translates poorly for the bond market because it may provide an indication of potential inflationary pressures. As an example, the following shows a positive reaction from the S&P 500 Index on a stronger than expected ISM Manufacturing Index for the month of February 2022 (Estimate: 58.0, Actual: 58.6), which was released on March 1, 2022:
Source: Refinitiv Workspace
Construction of the ISM Manufacturing Index
Survey respondents are broadly diversified across industries based on the North American Industry Classification System (NAICS). The number of survey respondents within each industry varies depending on that industry’s share of the U.S. GDP.
The 18 industries represented include Food, Beverage & Tobacco Products; Textile Mills; Apparel, Electric Equipment, Appliances & Components, Transportation Equimentment, Primary Metals, Computer & Electronic Products, Petroleum & Coal Products, and Fabricated Metal Products, among others.
To collect data for the index, purchasing and supply executives in the various industries are surveyed on whether the ten economic activity indicators (New Orders, Production, Employment, Inventories, Supplier Deliveries, Customers’ Inventories, Prices, Backlog of Orders, New Export Orders and Imports) at their firm have moved in the positive economic direction (higher, better and slower for Supplier Deliveries) or negative economic direction (lower, worse and faster for Supplier Deliveries) versus the previous month.
For each economic activity indicator, a diffusion index is calculated, as follows:
% Positive Responses + ½ * (% Neutral Responses)
For the ISM Manufacturing Index, the calculation involves a 20% equally weighted summation of diffusion indexes of these five components:
- New Orders
- Production
- Employment
- Supply Deliveries
- Inventories
An example is provided below:
Example of Constructing the ISM Manufacturing Index
The following shows survey participant responses on each component of the ISM Manufacturing Index:
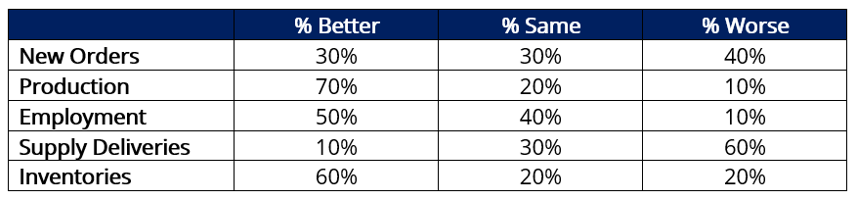
The ISM Manufacturing Index based on the above table would be calculated as follows:
20% * [60% + (½ * 20%]] = 58
As a result, the interpretation of an ISM Manufacturing Index of 58 would be that economic activity in the manufacturing sector in the United States expanded compared to the prior month.
Members also provide more anecdotal feedback that is included in the monthly PMI report.
Additional Resources
Thank you for reading CFI’s guide to the ISM Manufacturing Index. To keep learning and developing your knowledge, we highly recommend the additional resources below:
Financial Analyst Certification
Become a certified Financial Modeling and Valuation Analyst (FMVA)® by completing CFI’s online financial modeling classes!
Индекс менеджеров по закупкам в производственном секторе США от ISM (ISM United States Manufacturing Purchasing Managers Index (PMI))
Индекс менеджеров по закупкам в производственном секторе от ISM (ISM Manufacturing PMI) отражает условия ведения бизнеса в производственной сфере США в отчетном месяце. ISM – Институт управления поставками — некоммерческая организация США, в которой состоят более 40 000 участников, занимающихся управлением поставками и закупками.
Индекс рассчитывается по результатам опроса представителей нескольких сотен компаний из 18 отраслей производственного сектора США. В отличие от Markit, ISM учитывает в своем опросе не только частные компании, а основывается на общем списке NAICS (Системы классификации отраслей Северной Америки). Респонденты в своих ответах характеризуют следующие аспекты своей экономической деятельности:
- Новые заказы, полученные от клиентов;
- Интенсивность производства (скорость и уровень);
- Поставки от контрагентов (стали ли поставщики работать быстрее или медленнее);
- Товарно-материальные запасы предприятий;
- Запасы клиентов (примерная оценка уровня запасов, хранящихся у клиентов предприятия);
- Цены – больше или меньше организация платит за продукты и услуги;
- Задержка заказов – растет или уменьшается отставание в изготовлении заказов;
- Новые экспортные заказы — количество заказов, полученных для последующего экспортирования;
- Импорт — объемы импортируемых материалов;
- Занятость на предприятии.
В анкетах приводятся не абсолютные, а относительные характеристики: ситуация улучшилась, ухудшилась или осталась без изменений. Ответы оцениваются с учетом весов компаний-участников.
Полученные значения корректируются с учетом сезонных колебаний. Итоговый сводный PMI представляет собой составной индекс на основе пяти диффузных индексов с равными весами (это индексы новых заказов, производства, занятости, поставок и запасов).
Значение индекса выше 50 означает, что ситуация в промышленности улучшилась. Если индекс ниже 50, то экономические условия производства ухудшились. Чем дальше показатель удаляется от отметки 50, тем больше скорость изменения ситуации.
PMI считается одним из важнейших показателей здоровья экономики. Несмотря на то, что производственный сектор не является важнейшим компонентом ВВП страны, он по-прежнему остается ранним индикатором начинающейся рецессии или, наоборот, роста. Менеджеры по закупкам компаний обычно раньше остальных своих коллег «чувствуют ритм рынка», поскольку работают на краткосрочную перспективу и способны оценить тенденцию к изменению экономических условий. Индекс выходит раньше, чем ВВП и отчеты Бюро трудовой статистики, поэтому служит опережающим показателем.
Рост промышленного PМI обычно положительно отражается на котировках американского доллара.
График последних значений:
График всей доступной истории значений макроэкономического показателя «Индекс менеджеров по закупкам в производственном секторе США от ISM (ISM United States Manufacturing Purchasing Managers Index (PMI))». Пунктирной линией показаны прогнозные значения экономического индикатора на указанные даты.
Существенное отклонение реального значения от прогноза может вызывать кратковременное усиление или ослабление национальной валюты страны на рынке Forex. Особое место занимают пороговые значения индикаторов, призванные сигнализировать о приближении критического состояния экономики страны (региона).