Equity Risk Premium (ERP)
The Equity Risk Premium (ERP) represents the excess returns over the risk-free rate that investors expect for taking on the incremental risks connected to the equities market.
The difference between the returns from the stock market and the yields on risk-free assets with comparable time horizons is the equity risk premium, which compensates investors for the added risk.
How to Calculate Equity Risk Premium (Step-by-Step)
The equity risk premium (or the “market risk premium”) is equal to the difference between the rate of return received from riskier equity investments (e.g. S&P 500) and the return of risk-free securities.
The risk-free rate refers to the implied yield on a risk-free investment, with the standard proxy being the 10-year U.S. Treasury note.
The bond issuances by the U.S. government carry “zero risk” since the government could print money if deemed appropriate, so it’d be improbable for the U.S. government to default on its obligations.
No rational investor would accept greater risk in the form of a potential loss of invested capital without the possibility of receiving a higher rate of return – i.e. there must be an economic incentive for investors.
If the potential compensation is inadequate for investors, the risk of owning equities rather than government bonds is not justified.
Unlike a bond with a fixed interest payment schedule and the date of principal repayment, equity securities come with substantially more uncertainty regarding the investment outcome, which is a function of the free cash flow generation and profitability of the underlying company.
Equity Risk Premium Formula
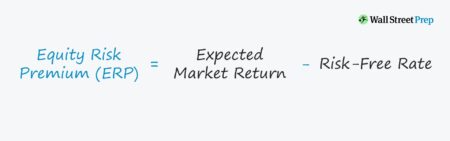
The formula for calculating the equity risk premium is as follows.
Market Risk Premium Calculation Example
Since the projected market return minus the yield on risk-free assets results in the equity risk premium, we can complete a quick calculation example.
Let’s suppose the estimated market return is 8% while the risk-free rate is 2%. The risk premium is 6% (i.e. 8% – 2%), representing the investor’s expected earnings from the investment in excess of the risk-free rate (rf).
Market Risk Premium vs. Expected Returns
In general, a higher equity risk premium corresponds to higher risk in the overall markets – hence, investors should ensure sufficient returns are obtainable from their portfolio of equities.
If the prevailing market valuations remain at the same (or higher) level despite falling equity risk premiums, this could indicate a correction in the stock market could soon occur (i.e. “market bubble”).
Therefore, the equity risk premium tends to increase if the risks and uncertainty in the outlook of the stock market increase (and vice versa).
Risk Premium in CAPM (and Cost of Equity)
The equity risk premium is an essential component of the capital asset pricing model (CAPM), which calculates the cost of equity – i.e. the cost of capital and the required rate of return for equity shareholders.
The core concept behind CAPM is to balance the relationship between:
- Capital-at-Risk (i.e. Potential Losses)
- Expected Returns
Here, the proxy for systematic risk (i.e. undiversifiable risk) is the concept of beta, whereas the equity risk premium measures the potential returns, taking into account the risk-free rate.
If plausible, investors seek to obtain the highest potential returns combined with the lowest degree of risk – but the more practical objective is to ensure that the expected returns are reasonable.
Historical Risk-Premium Factors
The U.S. stock market has averaged a 10-year return of 9.2%, according to research by Goldman Sachs, with a 13.6% annual return in the trailing ten years from 2020 pre-COVID (Source: Capital IQ).
In the same time horizon between 2010 and 2020, the 10-year Treasury note remained in the 2% to 3% range.
There are numerous factors that can impact equity risk premiums, such as:
- Macroeconomic Volatility
- Geopolitical Risks
- Governmental and Political Risk
- Catastrophic Risk and Disasters
- Low Liquidity
S&P U.S. Equity Risk Premium Index (Historical Chart)
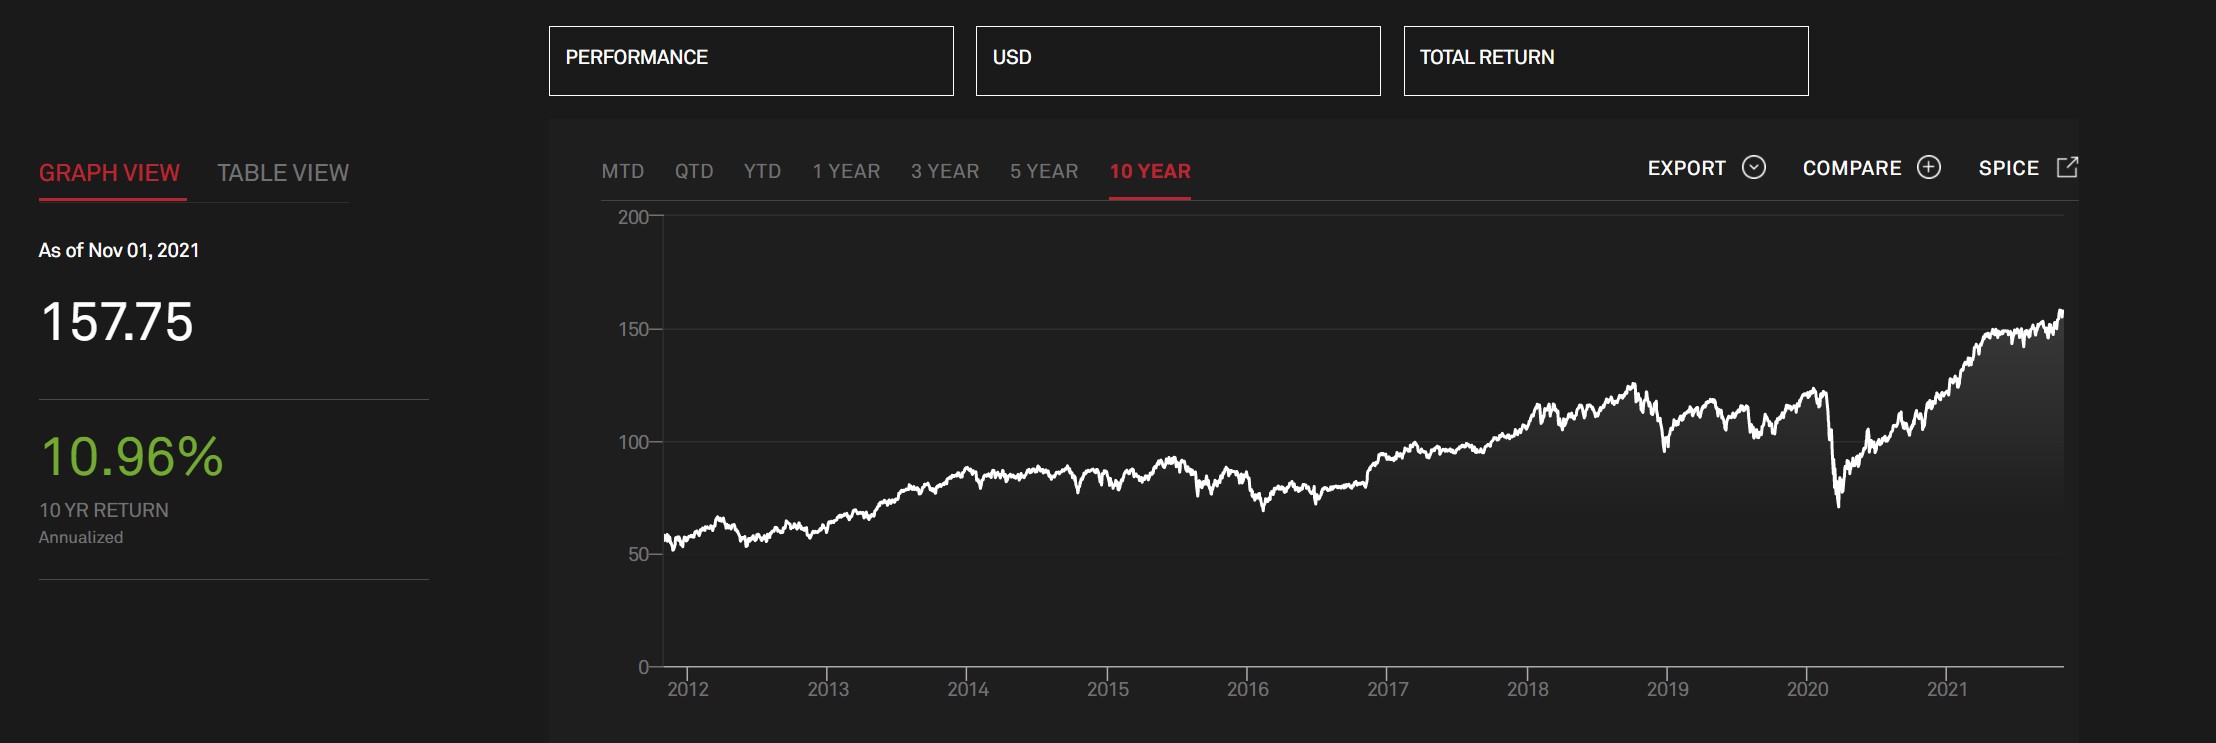
10-Year Historical U.S. Equity Risk Premium (Source: S&P Global)
Country Risk Premium (CRP)
When calculating the cost of equity under the CAPM approach, one common adjustment is called the country risk premium (CRP), which encompasses the same factors as listed in the previous section.
As one would reasonably expect, political instability, economic risks (e.g. recessions, inflation), default risk, and currency fluctuations impact countries unevenly.
For instance, the issue of hyperinflation in Venezuela that began in 2016 presents a significant country-specific risk that causes instability in all aspects of the country, whether political, socioeconomic, or financial.
With that said, equities in emerging markets come with higher risks, which means higher potential returns to compensate investors.
Hence, many institutional investment firms nowadays have raised foreign funds to pursue investments outside developed countries.
While part of the reason is diversification, another critical consideration is the limited number of investment opportunities in developed countries that meet their minimum returns hurdle.
Considering that foreign, less developed countries typically have fewer capital providers, outside firms often hold more negotiating leverage – directly leading to more compensation.
Learn More → ERP Determinants, Estimation, and Implications ( Damodaran )
Equity Risk Premium Calculator – Excel Model Template
We’ll now move to a modeling exercise, which you can access by filling out the form below.
Equity Risk Premium Calculation Example
In the first section of our modeling tutorial, we’ll calculate the equity risk premium.
The two required inputs are listed below:
- Estimated Market Return
- Risk-Free Rate
Here, we’ll calculate the ERP for two companies, one based in a developed country while the other is in an emerging market.
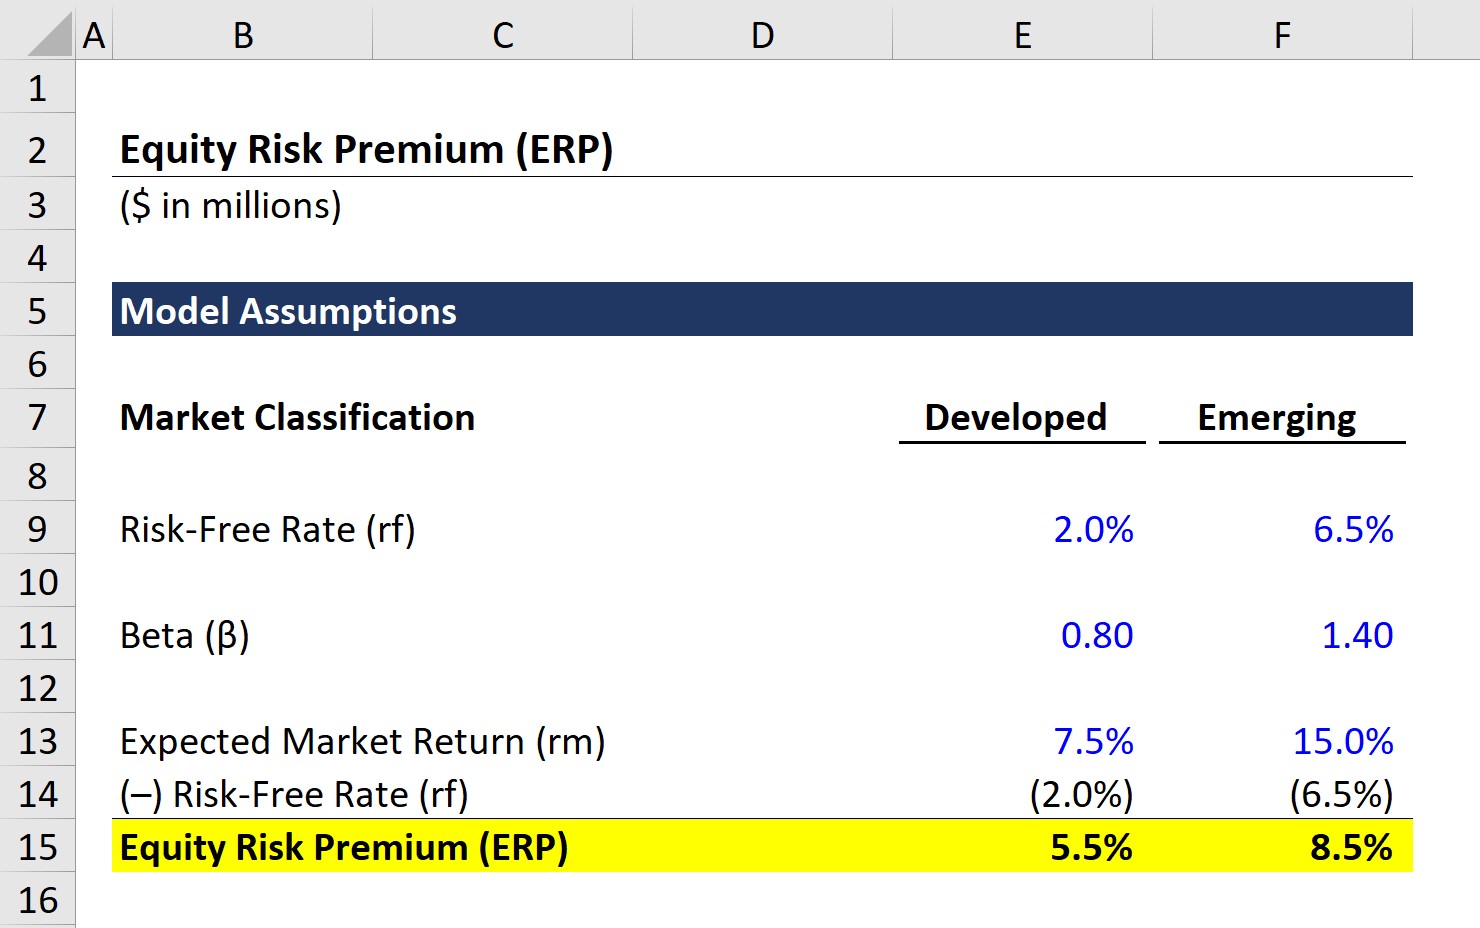
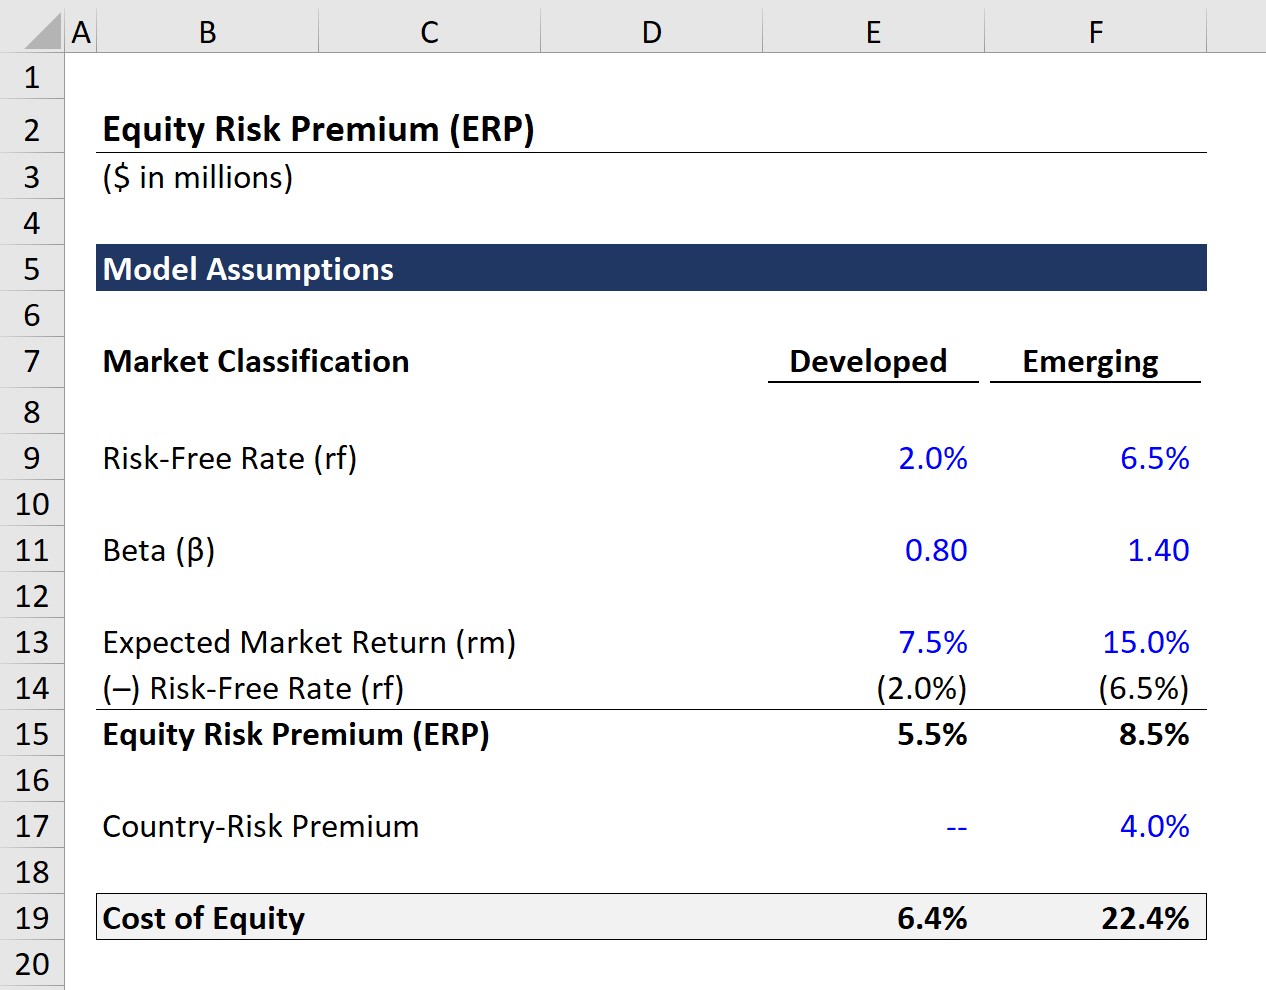
Developed Country – Company Assumptions
- Risk-Free Rate (rf) = 2.0%
- Expected Market Return (rm) = 7.5%
Emerging Country – Company Assumptions
- Risk-Free Rate (rf) = 6.5%
- Expected Market Return (rm) = 15%
For both companies, we’ll subtract the risk-free rate from the expected market return to get the following figures for our equity risk premium:
Equity Risk Premiums
- Developed Market – Company: 5.5%
- Emerging Market – Company: 8.5%
Countries with economies classified as “emerging” markets are less developed economically, so there’s more room for companies to come in and capture market share, but there are also more risks (and required expenditures).
The 5.5% and 8.5% ERP represents the excess return above the risk-free applicable to the appropriate country.
Note that the correct risk-free rate is for the country the company in question does business in, so using the 10-year Treasury note for a company in Japan is incorrect – as a general rule of thumb, the currencies should match.
As affirmed by our example, equity risk premiums tend to be higher in emerging markets than developed markets.
Country Risk Premium and Cost of Equity Calculation
In the next and final part of our modeling exercise, we’ll see how country-specific risks affect the cost of equity calculation under the CAPM approach.
For the company in a developed market (e.g. U.S.), there is no need for a country risk premium (CRP) adjustment.
However, a CRP adjustment would be appropriate for the company in an emerging market (e.g. Argentina, Brazil, Russia).
Here, we’ll assume the 4.0% CRP adjustment is added to the cost of equity calculation, as shown below.
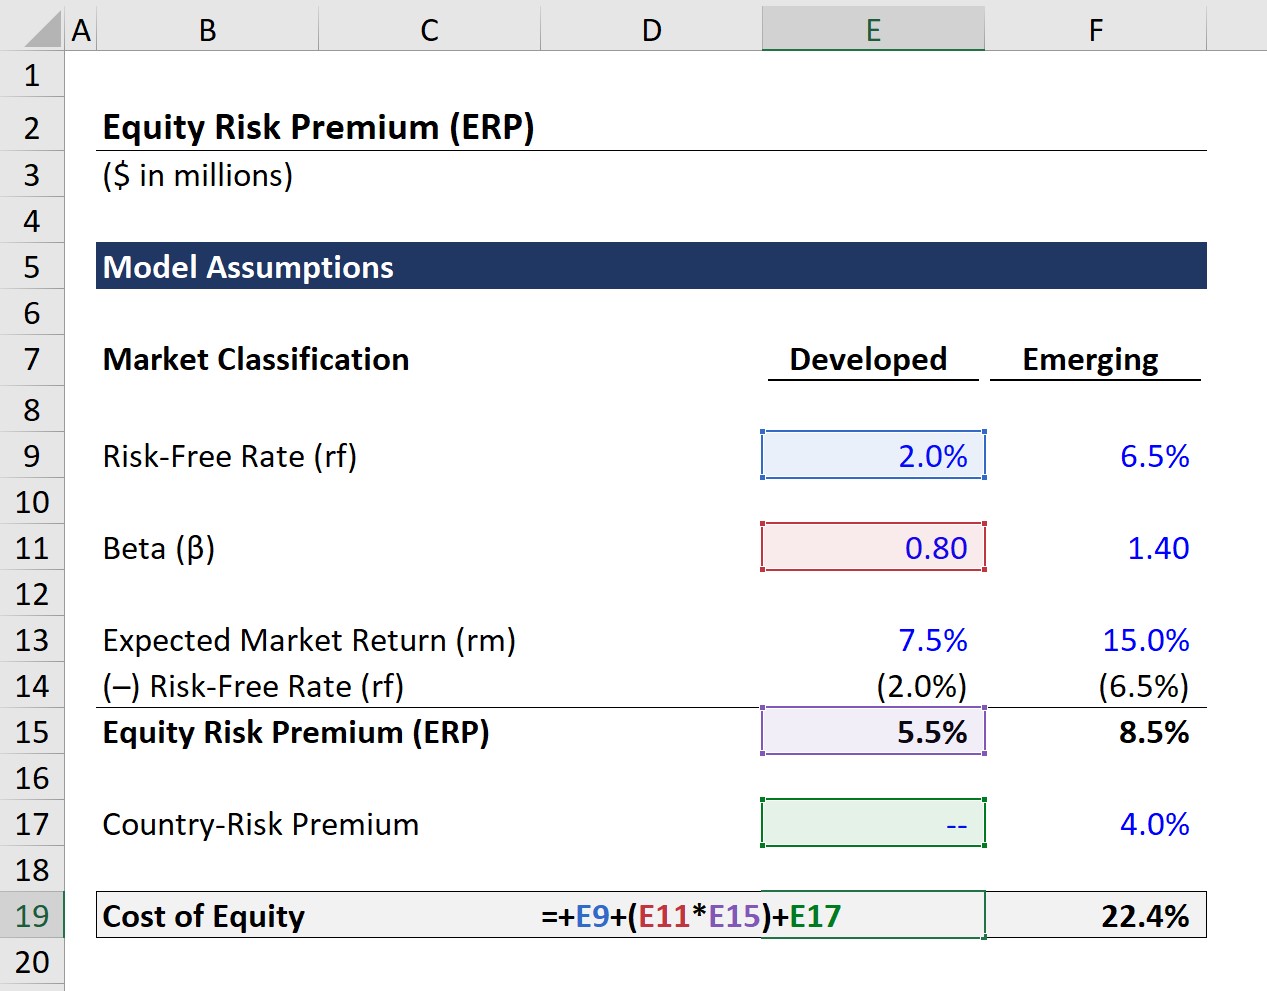
From our completed model, the calculated cost of equity is 6.4% and 22.4% in developed and emerging market companies, respectively.
Everything You Need To Master Financial Modeling
Enroll in The Premium Package: Learn Financial Statement Modeling, DCF, M&A, LBO and Comps. The same training program used at top investment banks.
What Is the Equity Risk Premium, and How Do You Calculate It?
The term equity risk premium refers to an excess return that investing in the stock market provides over a risk-free rate. This excess return compensates investors for taking on the relatively higher risk of equity investing. The size of the premium varies and depends on the level of risk in a particular portfolio. It also changes over time as market risk fluctuates.
Key Takeaways
- An equity risk premium is an excess return earned by an investor when they invest in the stock market over a risk-free rate.
- This return compensates investors for taking on the higher risk of equity investing.
- Determining an equity risk premium is theoretical because there's no way to tell how well equities or the equity market will perform in the future.
- Calculating an equity risk premium requires using historical rates of return.
How Equity Risk Premiums Work
Stocks are generally considered high-risk investments. Investing in the stock market comes with certain risks, but it also has the potential for big rewards. So, as a rule, investors are compensated with higher premiums when they invest in the stock market. Whatever return you earn above a risk-free investment such as a U.S. Treasury bill (T-bill) or a bond is called an equity risk premium.
An equity risk premium is based on the idea of the risk-reward tradeoff. It is a forward-looking figure and, as such, the premium is theoretical. But there’s no real way to tell just how much an investor will make since no one can actually say how well equities or the equity market will perform in the future. Instead, an equity risk premium is an estimation as a backward-looking metric. It observes the stock market and government bond performance over a defined period of time and uses that historical performance to the potential for future returns. The estimates vary wildly depending on the time frame and method of calculation.
Because equity risk premiums require the use of historical returns, they aren't an exact science and, therefore, aren't completely accurate.
To calculate the equity risk premium, we can begin with the capital asset pricing model (CAPM), which is usually written as Ra = Rf + βa (Rm — Rf), where:
- Ra = expected return on investment in a or an equity investment of some kind
- Rf = risk-free rate of return
- βa = beta of a
- Rm = expected return of the market
So, the equation for equity risk premium is a simple reworking of the CAPM which can be written as: Equity Risk Premium = Ra — Rf = βa (Rm — Rf)
If we are simply talking about the stock market (a = m), then Ra = Rm. The beta coefficient is a measure of a stock’s volatility—or risk—versus that of the market. The market’s volatility is conventionally set to 1, so if a = m, then βa = βm = 1. Rm — Rf is known as the market premium, and Ra — Rf is the risk premium. If a is an equity investment, then Ra — Rf is the equity risk premium. If a = m, then the market premium and the equity risk premium are the same.
According to some economists, this isn’t a generalizable concept even though certain markets in certain time periods may display a considerable equity risk premium. They argue that too much focus on specific cases has made a statistical peculiarity seem like an economic law. Several stock exchanges have gone bust over the years, so a focus on the historically exceptional U.S. market may distort the picture. This focus is known as survivorship bias.
The majority of economists agree, though that the concept of an equity risk premium is valid. Over the long term, markets compensate investors more for taking on the greater risk of investing in stocks. How exactly to calculate this premium is disputed. A survey of academic economists gives an average range of 3% to 3.5% for a one-year horizon, and 5% to 5.5% for a 30-year horizon. Chief financial officers (CFOs) estimate the premium to be 5.6% over T-bills. The second half of the 20th century saw a relatively high equity risk premium, over 8% by some calculations, versus just under 5% for the first half of the century. Given that the century ended at the height of the dotcom bubble, however, this arbitrary window may not be ideal.
Special Considerations
The equation noted above summarizes the theory behind the equity risk premium, but it doesn’t account for all possible scenarios. The calculation is fairly straightforward if you plug in historical rates of return and use them to estimate future rates. But how do you estimate the expected rate of return if you want to make a forward-looking statement?
One method is to use dividends to estimate long-term growth, using a reworking of the Gordon Growth Model: k = D / P + g
- k = expected return expressed as a percentage (this could be calculated for Ra or Rm)
- D = dividends per share
- P = price per share
- g = annual growth in dividends expressed as a percentage
Another is to use growth in earnings, rather than growth in dividends. In this model, the expected return is equal to the earnings yield, the reciprocal of the price-to-earnings ratio (P/E ratio): k = E / P
- k = expected return
- E = trailing twelve-month earnings per share (EPS)
- P = price per share
The drawback of both of these models is that they do not account for valuation. That is, they assume the stocks’ prices never correct. Since we can observe stock market booms and busts in the past, this drawback is not insignificant.