Как заработать на акциях. Урок 12. Earnings Per Share (EPS). Zoom vs AT&T
EPS — мультипликатор прибыльности бизнеса. Он отражает, сколько именно денег компания зарабатывает на каждой акции, и является массово применяемой метрикой оценки стоимости. EPS определяется как соотношение чистой прибыли к общему количеству обыкновенных акций, выпущенных компанией.
Формула 1
Данные берутся из баланса и ОПУ: количество обыкновенных акций на конец периода, чистая прибыль, а также дивиденды по привилегированным акциям (если они были).
Earnings Per Share = Net Income / Total Number of Shares Outstanding
- Практика применения в расчете средневзвешенного количества акций за определенный период считается более точной (исключается ограничение по времени).
- Такой способ используется для учета дробления акций/дивидендов по ним за отчетный период.
- Иногда EPS корректируют с учетом чрезвычайных статей и дивидендов по привилегированным акциям. Держатели привилегированных акций имеют приоритет при получении дивидендов в сравнении с обыкновенными акциями.
- Под «чрезвычайными статьями» понимаются события, которые считаются необычными для компании, редкие по своей природе. Прибыли/убытки, возникающие в связи с этими статьями, раскрываются в финотчетности отдельно за период, в котором такая статья возникла.
Формула EPS с учетом дивидендов по привилегированным акциям и чрезвычайным статьям
Формула 2
Earnings Per Share = (Net Income — Preffered Dividens — Extra-ordinary items) / Total number of Shares Outstanding
Есть два основных типа EPS:
.jpg)
Пример 1. ZOOM. Basic EPS
Базовый EPS:
- Basic EPS ориентирован только на общее значение обыкновенных акций в обращении.
- Basic EPS не отражает разводнение или конвертацию акций.
На период, окончившийся 31 октября 2020 года:
- чистая прибыль Zoom равна $198,44 m;
- в обращении 284,78 m обыкновенных акций.
EPS = $198,44 / 284,78 = $0,70

Пример 2. ZOOM. Diluted EPS
- Diluted EPS направлен на разводнение, возникающее в результате дробления акций, которое влияет на стоимость EPS.
- После исполнения опционов, варрантов и конвертируемых опционов общее число эмитированных акций, как правило, увеличивается, что, в свою очередь, снижает EPS.
- Diluted EPS всегда меньше базового EPS (или же равен ему). Он включает акции, не находящиеся в данный момент в обращении, но которые впоследствии могут быть выпущены (при реализации опционов на акции и другие ценные бумаги).
- Это ценный показатель для бизнеса со сложной структурой капитала.
На период, окончившийся 31 октября 2020 года:
- чистая прибыль Zoom равна $198,44 m;
- в обращении 284,78 m обыкновенных акций;
- cреднее количество разводненных акций Zoom, находящихся в обращении в течение квартала, составило 299,26 m.
Diluted EPS = $198,44 / 299,26 = $0,66
В сравнении с EPS $0,66 в январе 2020 (когда акции торговались на уровне $75) мы наблюдаем значительный рост компании.

Норма
Традиционно, чем выше EPS — тем прибыльнее считается бизнес. Также зачастую высокий уровень EPS указывает и на большую стоимость акции. Инвесторы готовы платить больше, полагая что бизнес генерирует более высокую прибыль в соотношении к цене акций.
Суть в том, что EPS имеет абсолютное значение: он показывает конкретную прибыль к акции эмитента в определенной денежной единице.
Этот момент всегда надо учитывать для сравнительного анализа EPS компаний и отраслей. Именно поэтому заявление о том, что более высокий EPS всегда отражает дополнительное преимущество бизнеса, звучит некорректно.
Пример 3. Zoom и AТ&T
Для понимания рассмотрим на примере двух компаний из одного сектора — Telecom Services: Zoom и AТ&T.
1. Для этого возьмем скользящей (TTM) Diluted EPS (для простоты можно посмотреть в биржевых сводках):
- Diluted EPS Zoom (TTM) = 1,44.
- Diluted EPS AT&T (TTM) = 1,52.
Как видим, значения EPS не особо отличаются. Но пока мы не посмотрим на цены акций указанных эмитентов, это никоим образом не свидетельствует о каких-то преимуществах.
2. Найдем цену акций (для примера на 10.12.20):
- цена Zoom = $385,96.
- цена AT&T = $31,46.


3. Посмотрим на соотношение цены/прибыли на акцию (P/E):
- P/E Zoom = 385,96 / 1,44 = 268,02.
- P/E AT&T = 31,46 / 1,52 = 20,7.
.JPG)

Как мы видим, реально акции Zoom очень переоценены. P/E Zoom уступает большей части конкурентов своего сектора. И в общей картине оценки акции компании AT&T значительно привлекательнее для инвесторов.
How to Use EPS for Evaluating Shares

To choose interesting stocks for investing, market players evaluate carefully various economic indices and statistics. This overview is devoted to one index called Earning per Share, or EPS.
What is EPS?
This Earning per Share index evaluates how profitable a certain company is in terms of one share. This multiplier shows the relation of net profit over a year’s time and the number of its ordinary shares in turnover, giving an idea of what profit can be brought to the investor by each share they buy.
In essence, each shareholder holds their share of the authorized capital of the company that equals to the number of issued shares. The profit made is given proportionally to each shareholder. So, the EPS multiplier reveals how much money out of the invested sum will return to the investor. The higher the EPS, the more profitable it is to invest in the company.
The profit made by the company can be fully or partially given to the shareholders as dividends. Here, things depend on the decisions of the board of directors. Shareholders via their representatives on the board can influence the issue, altering the share of the profit that will be given out to the shareholders in the form of dividends.
How is EPS calculated?
For calculating EPS, we use the net profit minus dividends on privileged shares. the formula is as follows:
EPS = (P – Div) / N
- P is the net profit of the company for the reporting period (after taxes)
- Div is the dividends on privileged shares
- N is the number of ordinary shares in turnover in the reporting period.
Example of calculation:
As an example, let us use Netflix (NASDAQ: NFLX). Over the last financial year, the company reported 2,761,395,000 USD of net profit, while the total number of ordinary shares in turnover was 440,922,000 shares.
The balance report says that Netflix did not issue privileged shares, so in the calculation formula, we subtract nothing.
Dividing the net profit of 2,761,395,000 USD by 440,922,000 shares, we get EPS of 6.26 USD per share.
How to use EPS?
Using EPS, pay attention to two important issues:
1. EPS does not account for the market price of the share.
The multiplier calculates profit from a share, yet the formula does not include it’s market price. Hence, depending on the latter, the result of investing may vary quite a bit. To find out which profit each invested dollar brings, divide EPS by the price you have bought the share at.
Let us compare two companies:
- Company A has EPS $10 and its shares in the market cost $200 each. So the profit potentially made is (10 / 200) * 100 = 5%.
- However, Company But has EPS $5, while its shares are traded for $50 each. Your profit will make (5 / 50) * 100 = 10%.
As a result, though Company A has larger EPS, Company But looks more attractive for investing because its shares are traded at a lower price and bring a better revenue.
2. Use the dynamics of EPS for evaluation
To check whether a company is attractive for investing, experts look not as closely at the current EPS as at its changes over a year’s time. What investors want to see here is growth. The faster EPS grows, the more attractive the company is for investors.
EPS dynamics of a company may vary depending on the profit, the number of shares in the market, or both factors. The company can increase EPS by increasing the profit or decreasing the number of shares in the market via stocks buyback. Or, on the contrary, if the company increases the number of shares in turnover faster than its profit grows, its EPS will fall.
As a rule, investors assess EPS alongside other economic indices, such as P/E. If other indices are more or less the same, better EPS in the reporting period makes one company more attractive than others.
You can check EPS in economic reports or on websites. For EPS or American companies, for example, go to Finviz.com:
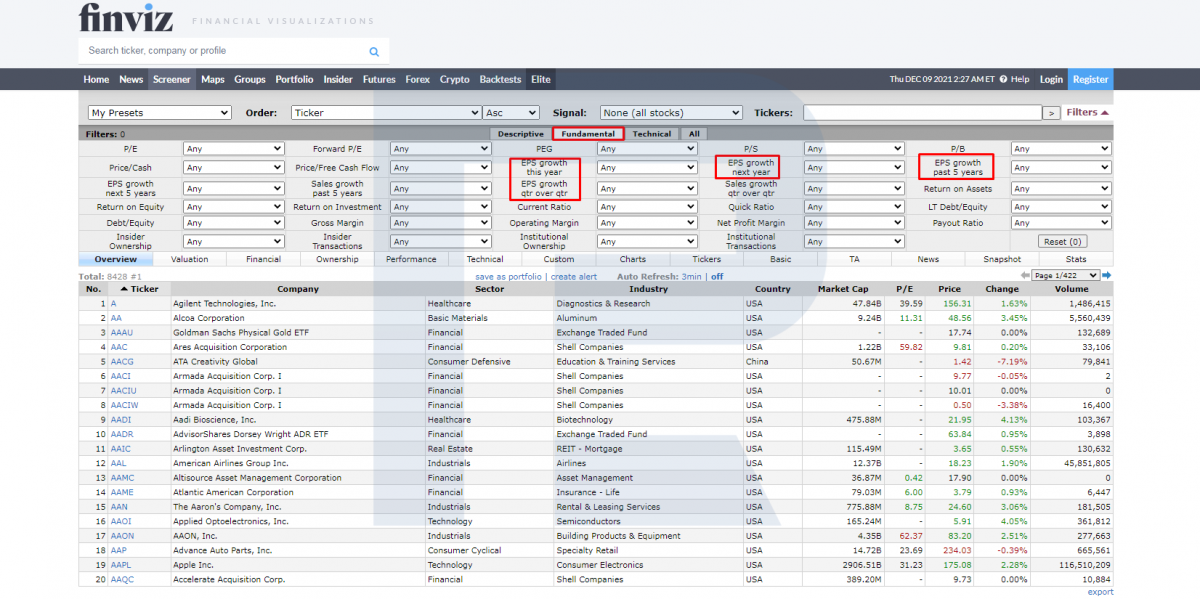
Filter "by EPS" is stocks screener
Advantages and drawbacks of EPS
The advantages would be:
- Availability and popularity
- Comprehensive approach: you can assess the ability of the company to bring you a profit per share at once
- Simple calculation formula and lots of open information sources where you can check the correctness of your data.
- Companies with a short lifespan are hard to evaluate because normally, EPS is evaluated in dynamics over several years’ time. So, use this one carefully if the company has been in the market for less than a couple of years.
- EPS value is absolute and needs to be related to the market price of the share for correctness. For a better result, use it alongside the P/E multiplier.
- The multiplier does not account for the influence of privileged shares if there are any.
Closing thoughts
EPS gives a chance to assess the potential profit made on one shares of the company you are planning to invest in. The multiplier has equally advantages and drawbacks, so it is recommended to be used alongside other multipliers, P/E being the most frequently used one.
How to Read P/E, P/B, EPS and PEG Ratios?
![]()
An easy(and more popular) way to find an answer to that is to look at the Net Profits of the company, and compare it with its closest peers. higher the company’s profits, better it is.
For example if a company X is generating a Net Profit of Rs. 200 crores while Company Y is generating a Net Profit of Rs. 50 crores, it seems obvious that Company X is doing better than Company Y.
Thinking higher profit generating companies make better investment is a huge misconception. Why? Because profit alone does not tell you how many shares the company has issued in order to generate those profits.
Taking the above example of Company X and Y, we have seen that Company X is generating far higher profits that Company Y, what it does not tell you is the total number of shares issued in generating those profits.
Why is that important? Because if a company issues higher number of shares, it shows that company is utilizing larger capital base to generate profits.
Taking the previous example, If the total number of shares issued by Company X is 100 crores, it means that company is able to generate a Earning per share of Rs 2 (200/100=2) for each share.
On the other hand, if Company Y is generating profit of Rs. 50 crores by issuing total 10 crore shares, it is far more efficient compared to Company X as it generates and EPS of 5 for each share.
See how things have changed dramatically? That is why focusing solely on profits may not be the best way to analyze a company, you also need to look at EPS, which give you more accurate picture of the real scenario.
Having said that, even EPS is not flawless, and in many cases is prone to manipulation, especially in case of share buybacks.
How EPS is Manipulated?
Many companies issue buyback of shares (that is, they buy shares of their own company) which reduces the number of outstanding shares, thereby boosting EPS without actual growth in earnings.
For Example: Let’s say a company X has Net Profit of Rs.1000 and has 100 shares outstanding. The total EPS as per the formula is 1000/100 = 10.
Now if the company announces buyback of 25% of shares (which amounts to 25 shares), post buyback, the total number of outstanding shares of the company would be 75. The recalculated EPS would then turn out to be 1000/75 = 13.33.
As you can see from the example above, the EPS was boosted by 33% without any earnings growth, just by changing the number of outstanding shares.
Many companies use these manipulation techniques to hide their poor performance from investors, and paint a rosy picture of their financial performance.
Thus, while calculating EPS, you must be careful and look if there is any change in number of outstanding shares since previous year.
P/E ratio:
One of the most commonly used valuation metrics, widely used and quoted by analysts and investors to understand the attractiveness of an investment. P/E ratio is based on EPS and is calculated by dividing the share price of the company by EPS. the formula for P/E Ratio is as follows:
P/E Ratio = Market Price/ Earnings Per Share
As the formula suggests, P/E Ratio measure the attractiveness of an investment based on how much an investor is paying against each rupee earned by the company, for example if a company is trading at Rs 100 per share and has an EPS of Rs. 10, the P/E for the company will be 10 (100/10 = 10) which means you are paying Rs. 10 for each rupee earned by the company.
So how does P/E Ratio helps us in finding better investment? Most investors rely on stock price as a metric to find attractive businesses, so from their point of view, a stock trading at a price of Rs 50 per share is far more attractive investment compared to a stock trading at a price of Rs. 100 per share.
While this may sound logical, it has a major flaw that most investors do not understand. The attractiveness of an investment is not measured by the price of the stock, but the earning ability of a business.
A stock, despite its lower trading price may be a poor investment, why? because the attractiveness of an investment does not depend on the price it is trading at, but the earning ability of the business.
Let us take the example of ICICI bank and HDFC bank, two leading private banks in the country, at the time of writing this answer, while ICICI bank is trading at a price of Rs. 401 per share.
HDFC bank, on the other hand is trading at a price of Rs. 2,280 per share
investors focusing solely on price may find ICICI bank an attractive investment compared to HDFC bank because of its lower price, after all, with the same amount of capital, you can buy almost 5 shares of ICICI bank instead of buying just 1 share of HDFC bank.
This is where P/E ratio helps you unravel the truth.
Look at the P/E ratios of both the banks (blue box), as you can see, ICICI bank, despite its lower quotational price is trading at a much higher P/E of 42 compared to HDFC bank, trading at a P/E of 29.45.
It means that if you are investing in ICICI bank, you are paying Rs.42 against each rupee earned by the bank compared to only Rs.29 for each rupee earned by HDFC bank.
In other words, you are paying far less for the earnings of HDFC bank compared to ICICI bank, making former, a better investment.
The example above shows that price of the stock does not determine the attractiveness of an investment, but it is the earning ability that matters the most.
PEG Ratio:
“An investor today cannot profit from Yesterday’s growth”- Warren Buffett
While P/E ratio is a good metric to measure the attractiveness of the business, there is a major drawback of using it as a valuation metric.
P/E ratio evaluates the stock based on the past earnings of the company, and does not give any insight on how attractive an investment is in terms of its expected future growth.
Since an investor’s return depends on how the company grows in the future, it is important to evaluate an investment by taking future expected growth into account. This is where PEG ratio comes into picture.
PEG ratio is a slightly advanced version of P/E ratio, where it evaluates the company on the basis of expected future earnings growth. The formula for PEG ratio is as follows
PEG Ratio = P/E Ratio/ Expected future Growth
As a thumb rule, if the PEG ratio of the stock is less than 1, it is considered as undervalued, while a PEG ratio of more than 1 is considered as overvalued
For example if a stock is trading at a P/E of 10 and its earning is expected to grow at 12% in the future the PEG ratio of the company would be:
10/12=0.83, which means that as per the current P/E, the company is undervalued compared to its future earnings growth potential.
Evaluating stocks based on PEG can at times, be difficult due to the fact that you must be able to assess the right future earnings growth of the stock.
An easy way of calculating the PEG ratio is to assume that past earnings growth of the company will company will continue in the future as well. However, it may not always be the case.
Companies that have seen rapid growth in the past may not be able to repeat the same growth in the future.
For example, if a company has posted a growth of 30% CAGR in the past 5 years may not be able to repeat the same growth in the future.
In such cases, you need to be conservative in your future growth estimates and perform a deeper analysis (such as growth of the sector the company is working in, competitiveness, peer growth etc.) in order to find a more realistic growth estimate.
Price to Book Value (P/B) Ratio:
Price to book value is a valuation ratio that evaluates the attractiveness of an investment based on the value of assets owned by the business, the simple logic behind using it was this, if a stock trading below its book value, it means that investors were able to buy the entire business at less than the total value of the assets.
The reason why P/B ratio got so popular was because back in the days, most of the businesses were manufacturing businesses such as textile, iron and steel, cement, automobiles etc, which required huge assets to build and operate.
A company trading below its book value was an attractive investment based in the assumption that even if the company goes bankrupt, investors could still make money by selling its assets and sharing the proceeds from the sale.
Looking for stocks that were trading way below their book value was known as “cigar butt approach” as it required investors to look for cheap and mediocre businesses that could be easily liquidated to make quick, and almost free money.
P/B value has nowadays less significance as companies are more service oriented and are working on asset light model, evaluating such businesses on the basis of P/B ratio will give you erroneous valuations.
However, P/B can be used to analyze banking stocks, why because all the money lent by the banks to its borrowers is considered as asset and is accounted for in the book value.
Thus if a bank is trading below its book value, it means that the stock is trading below its assets (which does not include the interest earned on those assets), making it an attractive investment.
However, price to book value should not be the sole criteria of evaluation, there are many factors that must be looked at before investing in a banking stock.
for a detailed, step by step process on how to analyze banking stocks, read the post below for FREE.
My name is Ankit Shrivastav, a SEBI registered Research Analysts (reg no. INH000006758) Founder of INFIMONEY.
Disclaimer: Stocks discussed above are not recommendations, or a financial advice, I would encourage investors to do their own research before investing.
Финансовые термины
Это соотношение чистой прибыли компании к количеству акций в обращении. Показывает эффективность ее работы и «силу» среди конкурентов. Также используется для приятия инвестиционных решений.
© 2023 Lime Trading (CY) Ltd
Lime Trading (CY) Ltd сертифицирована и регулируется Кипрской Комиссией по ценным бумагам и биржам в соответствии с лицензией No.281/15 от 25/09/2015. Торговая марка "Just2Trade" принадлежит LimeTrading (CY) Ltd..
Адрес: Lime Trading (CY) Ltd
Magnum Business Center, Office 4B, Spyrou Kyprianou Avenue 78
Limassol 3076, Cyprus
Заявление об ограничении ответственности:
Вся информация и материалы, размещенные на сайте компании могут использоваться исключительно с разрешения компании. Для получения дополнительной информации обратитесь к представителям компании.
Предупреждение о рисках:
Торговля финансовыми инструментами связана с существенным риском. Стоимость инвестиций может как увеличиваться, так и уменьшаться, и инвесторы могут потерять свой капитал. В случае маржинальной торговли потери могут значительно превышать изначально инвестированный капитал. С подробной информацией о рисках, связанных с торговлей на финансовых рынках, можно ознакомиться в разделе Общие правила и условия оказания инвестиционных услуг.